
I would like to softly explain the concept of how to design the sample size required for A/B testing for those who are sometimes in charge of improving landing pages but honestly do not understand statistics and significant differences.
#1. Introduction
A/B testing is a test to determine “which pattern is the most effective” based on aggregate data over a certain period of time by equally displaying multiple pages with different appearances(※1). I think it is often implemented for the purpose of improving services, such as increasing CVs. In this article, I will softly explain the concept of how to create a hypothesis and how to design the necessary sample size when conducting A/B testing, in order to avoid a situation where no insights are found because no significant differences were found after the test was conducted. This article is intended to be a very introductory article for those who honestly don’t know much about statistics and significant differences, so I recommend that those who want to learn thoroughly as a beginner read a specialized book.
※1 Basically, it is assumed that the target audience is homogeneous and that the verification is conducted under the same conditions of incoming traffic. In this case, I will assume that different pages will be verified at the same time and over the same period of time.
#2. Build up a hypothesis
Hypothesis testing is the process of testing the truth of a hypothesis through experimentation and research. In A/B testing, a hypothesis is something like “the new design will attract more new users than the existing design”.
Hypothesis testing in practice can be interpreted as the repetition of the following three processes: (1) analysis of the current situation, (2) hypothesis setting, and (3) hypothesis testing.
(1) Analysis of the current situation
First, we will check the current conditions of the measures and services, and conduct in-depth analysis. For example, by analyzing the number of users and CVs by channel, CTs by link, etc., we will be able to identify the most important points to take action. Once you have determined that the point of action is the existing LPs (and that there is room for growth), the next step is to formulate a hypothesis.
(2) Hypothesis setting
In setting a hypothesis, you set a tentative answer (hypothesis) that seems plausible based on the facts confirmed in the analysis of the current situation in (1), such as “the number will increase if we do this more”. If you have confirmed from your analysis that “CV of LP with A design is not good (lower than expected)”, you can hypothesize that “LP with B design has higher CV than LP with A design” (※2).
※2 When actually conducting a test, it is necessary to design a sample size in advance, so we need to be more specific and estimate how high the CV will be based on similar past results, and then set a hypothesis. This area will be explained later.
(3) Hypothesis testing
Once you have set a hypothesis, you will conduct an A/B test to confirm the truth of the hypothesis, and analyze and verify the results. If the hypothesis is correct, a new hypothesis will be formulated for further improvement, or other high-priority issues will be addressed, and if the hypothesis is incorrect, the hypothesis will be revised, the survey will be conducted again, and the results will be analyzed and verified, and the process will be repeated.
(´・ω・`).oO(Personally, I think it is very important to organize issues from the analysis of the current situation, determine the targets for improvement actions, and set up hypotheses in part (1))
#3. Design sample size
Before conducting an A/B test, the sample size (≠ number of samples) must be calculated from the difference (effect size) you wish to detect.
The “significance level”, “power (※3)”, and “effect size” values are necessary to design the sample size. The “significance level” is often set at 0.05 or 0.01, and the “power” is usually set at 0.8. Since this is a common sense story in the scientific community, it is best to assume that this is the way it is and that the “significance level” should be set at 0.05. Therefore, in practice, you may think that only the “effect size” needs to be actually calculated according to this test.
”Effect size” refers to “the degree of difference you want to detect,” and is an indicator used to see the effectiveness of A/B testing, so it is good to think of CV as corresponding to that in A/B testing for LPs.
※3 The “power” is the probability of correctly rejecting the null hypothesis, as described below, and it increases with effect size and sample size (due to smaller distributional variation).
The “effect size” is estimated based on past performance data. For the same power, if the “effect size” is large, the sample size should be small, while if the “effect size” is small, the sample size should be large. Therefore, it is desirable to already have a reliable estimate of the “effect size,” but there may be cases where there is nothing suitable as an estimate in the past performance data. In such cases, you will want to look at the effect in detail as accurately as possible in order to accumulate actual results, so it is a good idea to have as large a sample size as possible while fully considering the risk of lower sales figures.
Now, to test the hypothesis, let’s consider conducting an A/B test with a hypothesis test. In this case, assuming that the KPI is CVR, which can be expressed as “buy/not buy (can be expressed as 1,0)”, the A (control) and B (test case) of the A/B test could be as follows.
A: LP of A design with 2% CVR
B: LP with B design expecting 5% CVR
In order to test the hypothesis that “B has a 3% higher CVR than A” (※4), it is important to conduct an A/B test and calculate a sample size that is large enough (significantly different) to allow the results to be judged.
※4 The main testing methods are the χ2 test, binomial test, and t-test, but since it is implicitly assumed that the sample size of data subjected to A/B testing is large enough for web-based data, it is expected to return almost the same results (significant or not) regardless of which of these testing methods is used (In fact, there are different cases in which each test method is suitable for use).
To calculate the sample size, based on statistical understanding, we generally set the probability or distribution as α (significance level) or β (1-β: power) and calculate the sample size using Excel, R, Python, etc. However, here we would like to describe a more field-oriented case using the following useful tools for the purpose of enabling A/B test promoters to conduct A/B tests that properly show significant differences.
Sample Size CalculatorCalculator to determine the minimum number of subjects to enrclincalc.com

For “Study Group Design”, you can basically choose “Two independent study groups”, which means that the two target users will behave independently (unaffected by others) on an equal scale.
For the “Primary Endpoint,” we will consider the case of “buy/not buy (can be expressed as 1,0),” so “Dichotomous” will be fine.
In the “Statistical Parameters” section, “Anticipated Incidence,” enter the average CVR of the control in “Group 1” and the expected CVR for the test case in “Group 2.” The “Enrollment ratio” represents the ratio of the number of samples, so basically “1” is fine.
For “Type I/II Error Rate,” “Alpha (α)” is generally set to 5% (0.05), and “Power” is generally set to 80% (0.8), so I suggest you start with those settings.
Finally, press “Calculate” to calculate the sample size.
I would like to briefly add some additional information about Alpha(α).
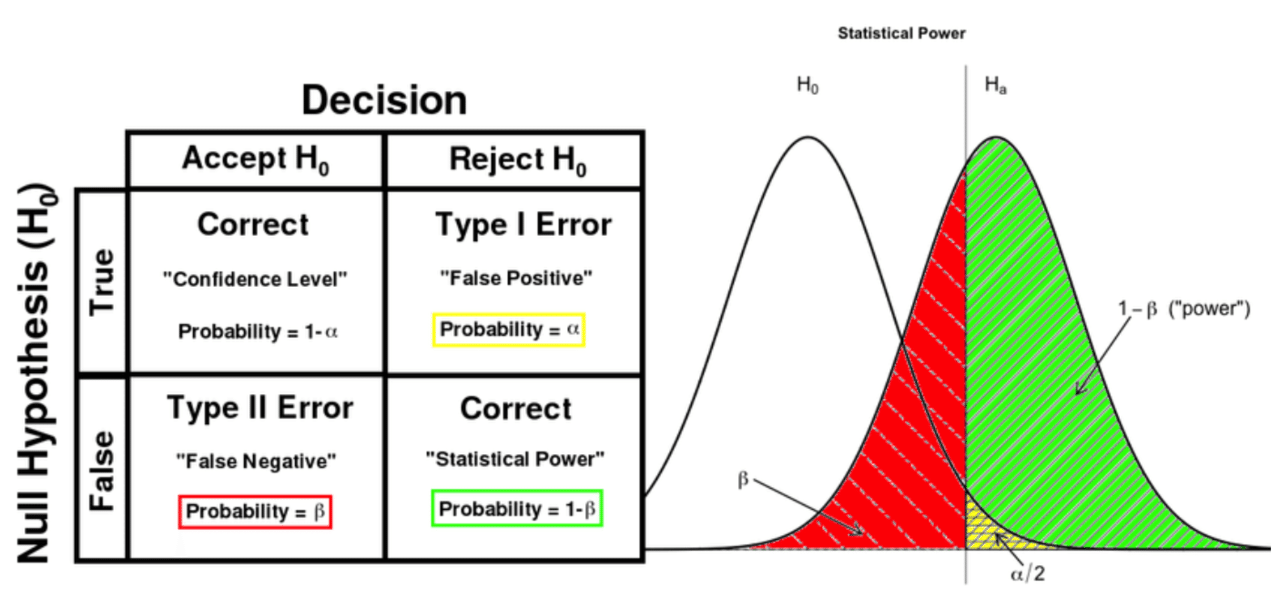
The significance level is generally expressed as alpha and refers to the probability of “concluding that there is a difference even though it is true that there is no difference.
A significance level of 5% means that “an event that has a probability of occurring less than 5% is an event that occurs less than 5 times in 100. The fact that this extremely rare event occurred can be interpreted as meaning that it has some significance.
– If you think the hypothesis is the opposite of what you want to confirm…
In hypothesis testing, a hypothesis is tested by rejecting what is called a null hypothesis. Now, the hypothesis we wanted to prove was “B has a higher CVR than A”. In this case, the null hypothesis would be “There is no obvious difference between B and A that determines the difference in CVR”. If we can say that this null hypothesis “rarely occurs” (rejecting the null hypothesis), then we can say that it is extremely likely that the null hypothesis was false, i.e., it is extremely likely that B is more effective than A.
* I found a clear graph on alpha and beta in Data Science Study Protocols for Investigating Lifetime and Degradation of PV Technology Systems and reproduce it below for reference.
# 4. Why is it necessary to design the sample size before testing
Now, let’s consider why we need to determine the sample size before testing.
As noted above, the larger the sample size, the more the precision of the estimation will increase progressively (the smaller the population variance of the estimator of the mean, the higher the probability that the estimator will take a value close to the true value). In practice, however, the sample size used in hypothesis testing should not be too large. This is because if you can increase the sample size as much as you want, you can reject any hypothesis test (you get a significant difference and you know which one is better! ).
If the sample size was not determined in advance and a significant difference was found, the following two possibilities can be considered :
case (i). When a significant difference emerged because the difference between the results of each pattern (between groups) was large (※5)
case (ii). When the sample size was large and a significant difference was found.
What we want to make sure of is the case (1). If the sample size is not determined in advance, there will be a case (case (ii)) where there is little difference between the results of each pattern, but the sample size is large enough to cause a significant difference (case (ii)).
※5 It refers to the case where the p-value is small. The criterion for small p-value is the significance level (α).
This problem can lead, for example, to the following situation:
A was wrongly judged to have resulted in a higher CVR for the control case A than for the test case B, even though there was no significant difference between A and B, and A was adopted. However, the qualitative UX validation results showed that B had by far the better results and better quality, so the decision to adopt B in the long run was correct ……
Also, when testing with a large sample size, you can see significant differences down to the smallest decimal point, but at the same time you run the risk that your numbers (e.g. sales) will go down for that period.
On the other hand, if the sample size is too small, it is difficult to tell whether the results obtained are due to the small sample size or to the test itself. If the sample size is too small, the test itself may be meaningless and valuable time may be wasted because differences cannot be detected when they should be detectable.
So, I think that testing needs to be done on an appropriate sample size, and that decisions should be made on a case-by-case basis in cooperation with those responsible for the numbers that the test will affect.
# 5. Points to keep in mind in practice
Finally, I would like to note 2 points to keep in mind when conducting A/B testing in practice.
##5-1. Estimate the test period
Before conducting A/B testing, it is a good idea to estimate how long the test should be conducted.
Based on past results, it should be possible to roughly estimate the number of impressions over a certain period of time, and by estimating the number of days required for testing based on this, it will be possible to make improvements efficiently without wasting many test days.
Before the end of the pre-estimated period, it would be important to check the situation using publicly available tools. Here is an example of a tool provided by the very famous British marketer NEILPATEL.
It is also important, from the perspective of speed of improvement, to agree in advance on a period of time during which the test will be forcibly terminated in case no significant difference is found after the expected period of time, although this is something that should be avoided.
##5-2. Make target group homogeneous
When conducting A/B testing, for example, in the case of an LP, it is usual to randomly display an arbitrary percentage of users in Design A and Design B. However, if technically possible, it would be better if the users to whom the test cases are displayed could be selected so that they are of equal quality and homogeneity. If Design A (existing page) and Design B (test page) are displayed to a skewed proportion of users who have already purchased with Design A and users who have not purchased with Design B, this will work to the advantage (or disadvantage) of Design A in the evaluation.
# 6. Conclustion
In this article, I have softly and fluffy explained my thoughts on how to set up a hypothesis in A/B testing and how to design a sample size.
This post was inspired by the fact that I, currently working for an IT company, have observed many situations where A/B tests were conducted but no significant differences were found, so conclusions could not be drawn and time was wasted without gaining any insights. I have tried to explain in the simplest possible terms so that you can conduct a meaningful test without a deep statistical understanding of the test. There are many easy-to-understand websites and books out there, but not everyone is willing to read and understand them, and I was prompted by a senior colleague at my company who said, “I wish you would explain it without using formulas.”
Finally, I am not an expert in statistics, having learned a bit of statistics when I was a college student and am currently self-studying. I have researched and prepared this article to be as error-free as possible, but I would appreciate it if you could let me know if there are any inappropriate statements in this article.
Excellent insights in your article. We completely agree with the author. The author have given some valuable tips.
Great items from you, man. I’ve take into accout your stuff prior to and you
are simply extremely fantastic. I actually like what you have obtained right here,
certainly like what you’re saying and the best way
during which you are saying it. You’re making it enjoyable and you continue to care for to stay it smart.
I can not wait to learn far more from you. That is really a great site.
Great article, exactly what I was looking for.
Outstanding story there. What occurred afteг? Thanks!